Seasonal Moorland Tech Calendar: What to Monitor Each Month
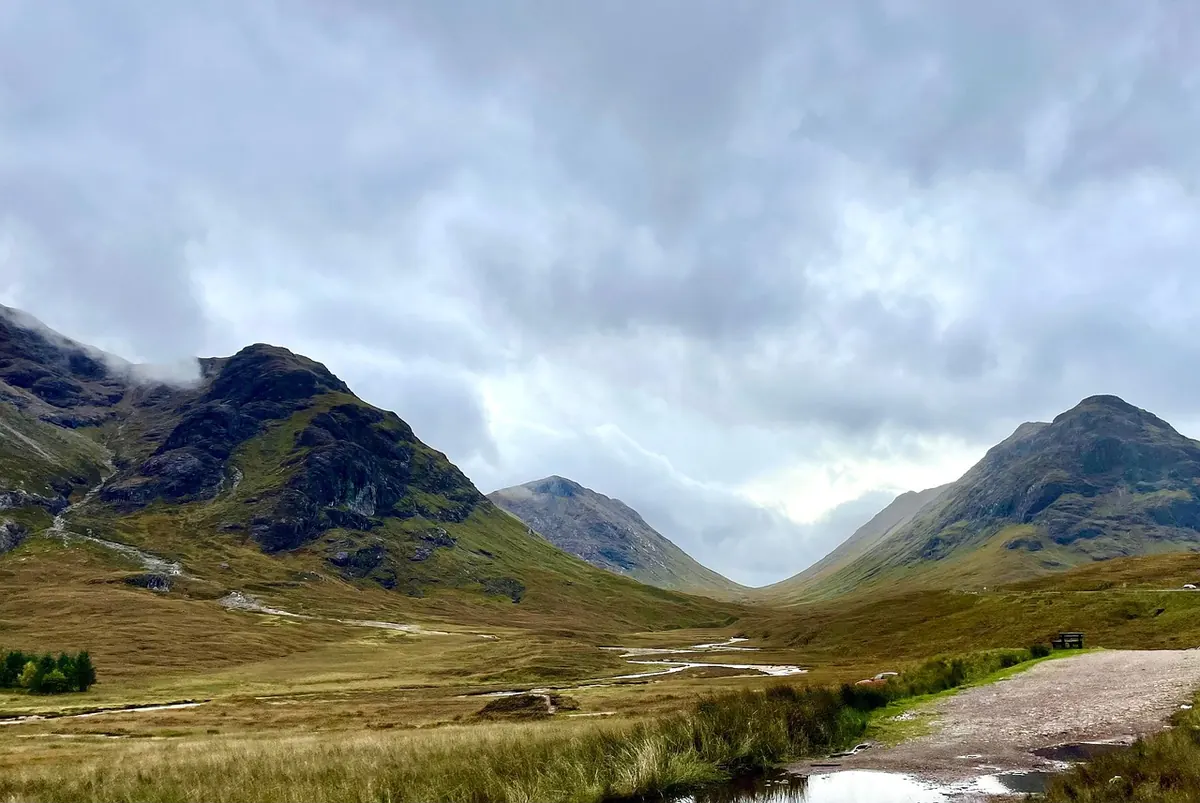
Most moorland monitoring fails for a dull reason: the kit was in the wrong place at the wrong time. A water-table logger installed in July misses the spring recharge it was bought to record. A drone flown in June over a nesting colony costs you a season and possibly a licence. Timing does more work than hardware. What follows is a working calendar rather than a rulebook. Your altitude, latitude and peat depth will shift every date by two or three weeks.
December to February: Low Power, High Value
December
Peat is at its most honest when it is cold and saturated. This is the month to install dip wells and water-table loggers, because a borehole drilled into a full peat profile will read a complete range from the start. Set pressure transducers to log at fifteen-minute intervals; a shorter interval on a cold, quiet site fills a card fast and tells you little extra.
January
File this month under maintenance. Swap batteries, replace desiccant sachets, update firmware, check that every enclosure still seals. If you fly drones and your permissions allow winter flights, bare ground gives the cleanest photogrammetry of erosion gullies and peat hags all year. Fly around midday, when the sun is high enough to stop shadows swallowing the detail.
February
Deploy acoustic recorders before the first waders and early songbirds return. Recorders placed now will capture pre-breeding calls you will never hear next month, when the wind and the traffic noise pick up. Bring in winter camera traps, or move them to track mammals using tracks that stay wet and readable until spring.
March to May: Peak Deployment, Peak Care
Nesting season changes the rules. From March onwards, most of your work should be remote: fixed sensors, cameras, recorders, satellites. Direct field visits should follow established paths and be short.
- March: switch ground sensors to "do not disturb" mode, reduce visit frequency, and check that any contractors working on restoration have stopped ground disturbance.
- April: install visitor counters ahead of the Easter and spring footfall. This is the month footfall data becomes meaningful, because you get a clean comparison between quiet and busy weeks.
- May: begin vegetation monitoring. Fixed-point photos, quadrats and a multispectral drone pass over the same transects each year beat a scattergun approach every time.
May also generates the most data of any month. Back up cards the same evening you collect them, and write the location, date and operator into the file name. You will not remember in November.
A logger left in the ground through February tells you more than three deployed in June.
June to August: Heat, People and Fire Risk
June
Long days, high light, fragile ground. Keep drones away from nesting aggregations even when the rules would technically allow the flight, and use thermal or infrared imaging only if you or your contractor hold the right permissions for wildlife survey where you are working. Visitor counters and trail cameras carry the month, not your boots.
July
Watch the water table. Dry summers show drawdown in the logger data weeks before you see scorched sphagnum, and that early signal is exactly what restoration planning needs. If you are near a road or a popular car park, low-cost temperature and humidity sensors give you a decent proxy for fire-risk conditions on the day.
August
Phenology cameras and repeat photographs do the heavy lifting here: heather, bracken and cottongrass all shift fast. Ground-truth satellite imagery while conditions are dry, using an offline field app that lets you mark points without a signal, then sync when you get back to the vehicle.
September to November: Data, Damage and Decisions
September
Download everything. Breeding-season acoustic files, footfall counts, water-table series, drone imagery. Then run the post-season erosion flight while the ground is dry but vegetation still masks nothing important. Analysing in October what you collected in May is a chore. Analysing it now is a pleasure.
October
Repair and redeploy. This is when contractors are back on site for restoration work, which means pre-works baseline surveys: water table, vegetation, and a drone flight you can repeat next year. Log the exact positions of every sensor before machinery arrives.
November
Take down visitor counters if they are not rated for winter. Leave water-table loggers in through the recharge period if the site is sheltered, and pull them from exposed ground where storm damage is likely. Label everything you remove, including the cables, which are the first thing to get mixed up in a shed.
A Month-by-Month Checklist
- January: batteries, firmware, seals, desiccant.
- February: acoustic recorders out, winter cameras in.
- March: reduce site visits, confirm nesting-season protocols.
- April: visitor counters installed.
- May: vegetation plots and drone transects.
- June: remote monitoring only, check drone permissions.
- July: review water-table drawdown, watch fire risk.
- August: ground-truth imagery, phenology photos.
- September: download and archive the season's data.
- October: pre-works baselines, sensor positions logged.
- November: winter-proof or retrieve hardware.
- December: install and calibrate water-table loggers.
Keeping the Calendar Honest
Write down what you actually did, not what you planned. A simple log with dates, sites, equipment serial numbers, calibration notes and anything that went wrong will improve next year's decisions more than any new sensor. Review it in January, shift the dates to match your site, and be honest about the tasks you skipped twice in a row; those are the ones to automate or drop.
Two habits keep the calendar lawful and useful. First, check the access, drone and protected-species rules that apply where you work, and check them again if the site or the season changes. Second, calibrate before you trust a number. An uncalibrated sensor produces confident nonsense, and confident nonsense travels further through a report than a gap ever does.
Photo: KarenRaven / Pixabay